I rather like CNBC’s Rick Santelli. He cut his teeth at the CME and CBOT, and speaks not as a refined journalist but as a sharp elbowed floor trader with heaps of actual experience. He cuts to the chase, he tells it like it is, he doesn’t shy from controversy or cliches. When he’s speaking, I tend to listen, and yesterday when he was reporting the seasonally adjusted housing units, I was listening. The existing home sales for the month of January printed at 4M seasonally adjusted annualized units, which was less than the 4.1M the street expected, marking the 12th consecutive month of volume decline. Rick then discussed interest rates (he’s a former VP of Rate Futures at Drexel Burnham Lambert), and called those rates the the death knell for housing. Those rates are at their highest levels since early last fall, and Rick proclaimed that those rates are now “haunting” the housing market.
I agree with Rick on this one, but only on a market specific basis. I would imagine that these rates are severely impacting the ability of many would-be-buyers to actually buy, but is a contraction in housing volume automatically a bad thing for housing? Is an increase in inventory automatically detrimental to pricing? I suppose that too depends on the specific market and to what degree rates are rising and inventory is increasing, but as for me and my market, I see no such concern. Lower volume in the absence of inventory actually drives prices higher.
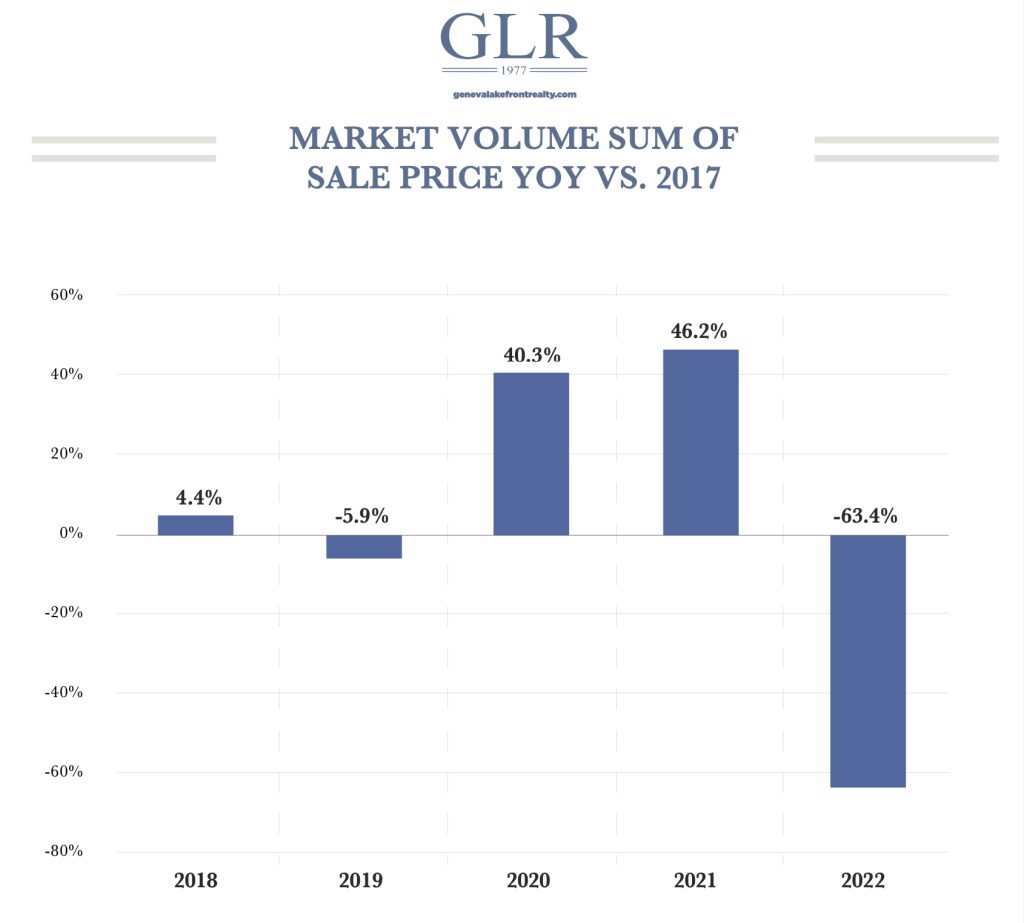
I made this chart that was supposed to find its way into my winter issue of Summer Homes For City People. I ultimately didn’t publish the chart because people sometimes don’t read charts correctly, and I didn’t want to create any confusion for the casual reviewer. The chart shows the relationship of volume to prior years, which proves a dramatic increase in volume for 2020 and 2021, followed by a sharp decline for 2022. The chart looks like a negative indicator, like somehow the market has run out of steam and it’s trapped in the middle of some uncontrollable death spiral.

The chart, without a corresponding chart showing inventory decreasing, is relatively meaningless. This chart combined with a chart that shows a massive spike in inventory would be an absolutely devastating indicator for any market. But in Lake Geneva, we’ve combined a slowing of sales activity with an absolute absence of lakefront inventory, and the result is a continued seller’s market. Prices have remained stable, buyers have remained active, and the downturn I expected to arrive last year has yet to show its face.
I wrote early in 2022 that it will likely be the low, long term interest rates that existing homeowners locked in during 2020 and 2021 that will save the housing market from any meaningful pricing decline. This is true for the primary market, but not so much for the lakefront market. What the lakefront market needs to see an increase in volume is some inventory. What I fear today is that the inventory will be brought to market at ridiculous, unhinged pricing. If there’s nothing for sale, then my tiny cottage must be worth $6M, some of the people might say. If there’s nothing for sale, then my beautiful $9M house must be worth $16M, I think people might think. For now, that’s only a fear, as the inventory hasn’t yet materialized and if I had to bet on one this this year, it’s that we won’t see any meaningful build up of inventory all year. We know that means our volume will be down, but prices? Probably up. If you’re a potential buyer or seller, we should talk.
Above, a photo to try to remind the market who sold Glanworth Gardens, since someone is trying to sew confusion.

