
By now, we all know the last two decades of market conditions at Lake Geneva. We understand the cycle. The market rose steadily from 1997 through 2008. Then the market fell from early 2009 through mid 2012. Today, we know we’re in year four or five of the latest bull market run. How long this run lasts is something we cannot yet know. I’ll let you know when it’s over. For now, we know the history and we understand it, but the biggest test for the market is beginning now. Not now in terms of September 2017, not now in terms of Autumn.
Every market runs in these cycles. Some cycles are longer. Some are shorter. Some are less aggressive on the way up and less considerate on the way down. What lies ahead is the interesting bit. I can guesstimate the percentages of appreciation and decline, with relative accuracy. I can tell you that at the bottom of our market cycle in 2011/2012, lakefront prices were off around 30% from their prior peak highs (2007/2008). I can tell you that since the market bottom we’ve regained perhaps 20% of those losses. In some cases, properties today are worth more than their 2008 market highs. Try telling that to a lakefront home languishing on market in the Highlands for a price that’s not dissimilar from what it would have fetched in 2012. This is the anomaly of Lake Geneva. The market does not rise and fall with uniformity.
But that’s not the test. That’s just the set up. The real test is in the actual prices paid for properties that sold perhaps at the prior market peak, then again at the market bottom, and now again in 2017. Today Lake Geneva is testing itself. It’s self inflicted, like volunteering to take a difficult exam even though the teacher is on vacation and the other students are still catching up on their week old homework. The test is to prove, not with my theoretical statistics, or with some silly Price Per Foot averaging game, just how far the market has come since 2012. The only way to really know is the look to the lakefront houses that sold in 2012 and see what they’re selling for in 2017.
We know there have been some resales that roughly align with this timing already. I’ve sold a few homes in the last few years that sold during the market bottom once and then again as the market improved. Many of these have sold under unique circumstances. I sold a home on Folly Lane several years ago at the market bottom that has since resold. But the property resold at a higher price to a neighbor because the neighbor had to have it. In the same way, the lakefront sale from last fall on the south shore of Fontana. The house that Matthew McConaughey was rumored to have bought (he didn’t). That home sold for a fat premium just one year after it originally sold. Was that a sign of the market appreciation? No, it was just an interested party pursuing a specific property. That sale looks nice in the MLS, but it isn’t a sign of broad market interest, nor does the PPF mean anything.
In order to really look at the gains since 2012, we need sales that have occurred at an arm’s length, under normal marketing conditions. We need an average sale. Moreover, we need several of these sales if we’re going to consider the outcome to be representative of the market. Thankfully, there are a few such sales, but for the sake of our concept, we’re going to need to cast a wider net. Let’s look at lakefront properties that have sold in the past 12 months that also sold between 2010 and mid 2013. In a low volume environment, which Geneva is in good times and bad, we’ll need to open the view to capture a larger sample size. Those MLS sales that match the stated criteria are as follows:
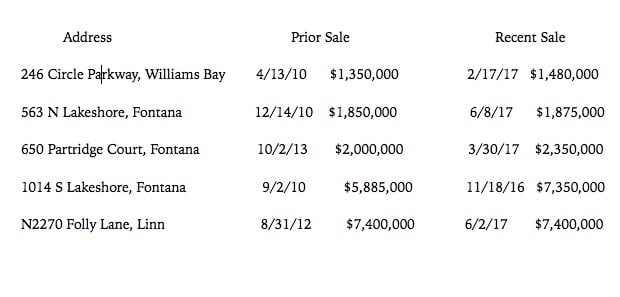
These are the handful of sales that follow our pattern. The sales are not exact, since transfer prices can fluctuate based on allowances for furniture and other personal property, and the sales are not particularly equal since a sale in 2010 was of a property that likely still depreciated through 2012. Additionally, at least one of these properties was remodeled and updated in between sale dates (1014 S Lakeshore). But this is all we have to base our estimates on. These sales point to an average increase of just 10%.
Is that it? Is that the answer to the question? Well, not really. This is just a small sample size. We sell on average around 23 houses a year on Geneva Lake and this is just a snapshot of five of those sales. I would guess the market gains across the board have been somewhere around 20% since our market bottom of 2011/12. The market hasn’t yet printed enough volume to draw attention to that gain, but that’s my estimate and my eye is fairly keen. The market today is testing that 20% theory with several current listings that had previously sold during that recent market bottom. On average, these sellers are seeking 30% or more over the prior sale prices. The test today is to see if a market that is as robust and active as our lakefront market can indeed support that large increase over such a short period of time.
Do we know the answer to that question? Nope, but the good news is that the question has been asked and the market will answer soon.